
Full Moon Observation
How the Planetary Fourier Spectrometer works
Many secrets of the Red Planet and lunar eclipse are hidden in its light. Embedded within the sunlight and heat reflected from Mars is a vast amount of information on the chemical composition of its surface and the gases making up its thin atmosphere, its ice and dust, and even the planet’s weather.
he lunar eclipses
When do the eclipses of the Moon take place?
There is an eclipse of the Moon when the Moon passes through the shadow cone or the penumbra cone of the Earth. The Sun, the Earth and the Moon are then almost aligned, which corresponds to the moment of the full Moon. If the plane of the orbit of the Moon were the same as the plane of the orbit of the Earth (ecliptic), there would be an eclipse of the Moon with each full Moon, however the plane of the orbit of the Moon is inclined by approximately 5 ° 13 'on the plane of the terrestrial orbit. The intersection of these two planes is a line called the line of nodes and the intersections of this line with the ecliptic are called nodes of the lunar orbit . So that there is an eclipse, it is thus necessary that the Moon is close to the line of the nodes at the time of the full Moon.
Periodicity of eclipses, the Saros
When the Moon and the Sun are in the vicinity of one of the nodes, there is an eclipse of the Sun or eclipse of the Moon. The difference between the average longitude of the Moon and that of the Sun, is a linear function of time which increases by 360 ° in 29.5305882 days, this period "L" is called the synodic revolution of the Moon, or lunar month or even lunation. The plan of the orbit of the Moon is animated by a movement of precession, thus the nodes cross the ecliptic in the retrograde direction (clockwise). The PN period of this knot movement is 18.61 tropical years, or 6,797,157,342 days. The difference between the average longitude of the Moon and that of the ascending node of its orbit is, like the lunation, a linear function of time which increases by 360 ° in 27.2122208 days, this period "G" is called draconite revolution of the Moon . In order for conditions favorable to an eclipse to return, we must therefore find a relationship between this period and the period of lunation. We must determine two numbers x and y such that xG = yL or x / y = L / G.
Using the method of decomposing reals in continuous fraction, we obtain among other things:
x / y = 1.085196 = 242/223
Or a period of 223L, therefore 18 years and 11 days. This cycle, already known to the Greeks, is called the Saros . During this cycle, we find on average the same number of eclipses. But the irregularities of the movement of the lunar orbit mean that the succession of the type of eclipses is not preserved.
In reality, this period is not an exact number of days, the fraction of a day is about a third of a day. So the eclipses reproduce well the same day but with a longitude offset of about 120 degrees.
Number of eclipses per year
We can calculate the number of observable eclipses in a calendar year. If we take into account all the eclipses, including the penumbra Moon eclipses, there are at least four eclipses per year, including two of the Sun and two of the Moon. The maximum number of eclipses per year is seven, but in this case there will never be a single eclipse of the Moon (and six eclipses of the Sun) or a single eclipse of the Sun (and six eclipses of the Moon), other configurations being possible alone.
The eclipse cannons
The lists of eclipses of the Moon and the Sun are published in books called c econs of eclipses . The best known is that of Theodor Ritter von Oppolzer, its first edition dates from 1887 in volume 52 of the Memoirs of Mathematics and Natural Sciences of the Imperial Academy of Vienna. This canon, corrected, is regularly reissued by Dover Publications . In this canon, there are 8000 eclipses of the Sun and 5200 eclipses of the Moon. It should be noted that there is no eclipse of the Moon in the dark.
We should also cite the canon of eclipses of the Moon by Jean Meeus and Hermann Mucke (1983, Astronomisches Büro, Vienne), containing all the eclipses of the Moon between -2002 and +2526.
Earth's atmosphere and lunar eclipse
During a total eclipse of the Moon, the light rays passing through the Earth's atmosphere are deflected by atmospheric refraction and illuminate the Moon. This luminous flux is closer to the center of the Moon and results in a reddish coloration, which somewhat recalls the color of the terrestrial sky at the time of sunset. The other regions of the Moon are not very colored, of a generally gray tint. The appearance, the colors and the intensity of the illumination are very variable from one eclipse to another, they are unpredictable and strongly depend on atmospheric weather conditions on the terrestrial terminator (the arc of large terrestrial circle delimiting the surface of the Earth seen from the Moon). Observation condition and duration of eclipses There are three types of Moon eclipses. Twilight eclipses, when the Moon only passes through the Earth's twilight cone. These eclipses are very unspectacular and are barely visible. Partial eclipses, when the Moon partly passes through the Earth's shadow cone. Total eclipses, when the Moon passes entirely through the shadow cone of the Earth. To observe an eclipse of the Moon, it is necessary and sufficient that the Moon is visible, therefore lifted at the place of observation. Time scale The dates and times are given in Coordinated Universal Time (UTC), the longitudes of the places are given in relation to the Greenwich meridian. Now the time scale used in the ephemeris is Earth Time (TT), it is therefore necessary, for future eclipses to know an approximation of the difference between Earth Time and Coordinated Universal Time. This approximation is obtained by extrapolating the current values. However, once we know the exact value of this difference, we can correct the published results as follows: if dtrepresents the difference, in seconds of time, between the actual value of TT-UTC and the estimated value of TT-UTC, then the instants of the phenomena will have to be corrected by dt , and the longitudes of dL = 1.002738.dt / 240 degrees east if dt is positive or west if dt is negative.Circumstances of an eclipse of the Moon
Each phase of an eclipse is characterized by the following instants: entering darkness,entering the shadows (for partial and total eclipses),
the start of the whole (for total eclipses only),
the maximum of the eclipse and its magnitude at this moment,
the end of the whole (for total eclipses only),
out of the shadows (for partial and total eclipses),
out of the dark.
For the entry and exit of the shadow and the penumbra, and for the beginning and the end of the whole, one can define the points of contact between the shadow or the penumbra and the lunar limb. For the entry and the exit of the shade and the half-light, one will speak about external contacts and for the beginning and the end of the whole, of internal contacts. These points are given by their polar angle, defined by the direction of the vector CO (center of the Moon - point of contact) and the direction CP (center of the Moon - North pole), this angle is counted positively in the retrograde direction at from the North. An eclipse of the Moon can last several hours (maximum 5 hours), to observe all the phases it is necessary that the Moon is lifted during the entire phenomenon, otherwise we can only observe part of the phases of the eclipse. To indicate the visibility zones of the different phases, these zones are plotted on a map. They are delimited by the curves which correspond to the terrestrial terminators defined by the large circles having for poles the coordinates of the places where the Moon is at the zenith at the instant of the beginning and the end of each phase. These are therefore the places on the globe where the Moon is on the horizon.
Data provided for each lunar eclipse
We give successively for each eclipse: the day or days when the eclipse occurs, the type of eclipse, the number of the eclipse in the Oppolzer's canon (penumbra eclipses are not numbered in this canon), the moment of opposition with the Sun in right ascension, the equatorial coordinates of the Moon and the Sun at the time of the opposition, the true parallaxes and half-diameters of the Sun and the Moon at the time of the opposition, the instants of the beginnings and ends of the different phases of the eclipse, as well as the instant of the maximum, the size of the eclipse, the values of the positions of the contact points for each phase of the eclipse, positively clockwise from the North, the geographic positions of the places that have the Moon at the zenith for each phase of the eclipse.The task of the Planetary Fourier Spectrometer (PFS) orbiting the planet on ESA’s Mars Express is to extract that information. Like all spectrometers, it works by breaking down light into a spectrum of individual wavelengths, in the same way that a glass prism converts white sunlight into a rainbow of its component colours.
Instead of the light we see, PFS is built to study a range of radiation from short wavelength ‘near’ infrared just beyond the threshold of the human eye up to longer ‘thermal’ infrared – which is the heat radiation we feel with the nerve endings in our skin.
This compact instrument – with a mass of 31 kilograms and about the size of a TV set – has two separate channels: one for short wave infrared, another for thermal infrared detection. Radiation beams are directed to these channels with a specially engineered mirror.
"PFS works much more precisely than the most finely made Swiss watch", says Vittorio Formisano.
Altogether PFS covers the widest infrared range of any instrument ever to orbit Mars or the Earth, the wavelengths stretching from 1.2 up to 5 microns and from 5 to 45 microns (millionth of a metre).
Many molecular species leave characteristic sets of absorption or emission features or ‘fingerprints’ within the infrared spectrum. The challenge for the designers of PFS was to achieve sufficient spectral resolution to detect these features within a small enough package to be sent to Mars.
"PFS works much more precisely than the most finely made Swiss watch," says Vittorio Formisano, Principal Investigator for the instrument. "It is certainly extremely precise in terms of its motion and synchronisation of actions, but this synchronisation has got to be not just mechanical but also optical, electronic and computational."
PFS does not rely on a direct means of splitting the Martian radiation into its spectrum of individual wavelengths, such as a prism or grating. Instead PFS is based around an optical occurrence called interference, where overlapping light waves interact with each other to either increase or decrease their combined intensity. Depending on the effect, this interference is termed either ‘constructive’ or ‘destructive’.
The same interference phenomenon is seen in ocean swells; when opposing waves meet on the sea their heights may combine together to produce a single higher wave, or they may cancel each other out to leave calmer waters. This depends on whether or not their wave peaks and troughs are synchronised, usually called being ‘in phase’. Most often the overlapping waves form mixed constructive and destructive swells known as ‘interference patterns’.
The optical system in PFS – with its long-wave and short-wave infrared channels working in parallel – is set up first to divide the beam of Martian radiation entering its given channel, then to recombine it in such a way that the phase of the component beams keeps shifting. This sets up interference ‘fringes’ of shifting light that are recorded by a photodetector.
The process begins when the radiation encounters a half-mirrored beam splitter set up at 45 degrees to it. The beam splitter divides the radiation into two identical halves, which proceed at a 90-degree angle away from one another. These two beams then meet mirrored corner cubes that are not like normal mirrors: they are designed to reflect light back in the exact same direction that it came from.
These corner cubes are not at rest but are in motion, set on the end of a double pendulum rotated by a motor. There are actually two double pendulums for the two infrared channels fixed to the same axis, with one resting on top of the other.
Each double pendulum moves so that the total length travelled by the pair of light beams becomes progressively more unequal. This difference in distance causes the twin beams – which have now been reflected back to meet each other – to move in and out of phase with each other. In turn this induces alternating patterns of constructive and destructive interference through the duration of a single measurement cycle – causing these ripple-like interference fringes.
This difference between the there-and-back again distance these twin beams end up travelling is termed their ‘optical path difference’. The maximum optical path difference achievable by the instrument is actually what determines its total spectral resolution.
With PFS the double pendulum rotates through a combined distance of five millimetres through the entire range of possible optical path differences. Some 16 384 separate intensity samplings are made in four seconds. It takes another six seconds to complete the measurement cycle by sending the results to the PFS electronics module to prepare for their despatch to Earth. Each sampling represents an optical path difference of 0.6 microns, corresponding to an actual physical displacement of the corner cube mirrors by 150 nanometres. Of course each time a mirror is moved this distance the beam has to travel there and back again, meaning twice that length. With two mirrors being moved at a time the total comes to 150 nanometres multiplied by four.
For accuracy it is vital to keep the accuracy rate constant and this is achieved with a laser diode whose light shines in parallel through the same optical channels as the sampled radiation. Unlike the broadband or multiple-wavelength Martian radiation, this laser light is monochromatic, which means it possesses a single fixed wavelength and, therefore, frequency. This means it can be used to time the sampling rate and control the motion of the double pendulum.
"The PFS is a powerful but extremely delicate instrument," Formisano adds. "Mechanical deformations as small as a micron – less than the width of a bacteria – can wreck the experiment completely."
The Martian radiation contains a continuum of wavelengths, each one of which gives rise to a different interference pattern across the entirety of the mirrored corner cube motion. What PFS actually returns to Earth is the overall interference pattern or ‘interferogram’ as measured by the detector, a summary of all the interferences from the various infrared wavelengths.
This interferogram is not in itself the Martian infrared spectrum, but it does have information on the total range of wavelengths ‘encoded’ within it. The application of a powerful mathematical tool called the Fast Fourier Transform – used across a wide array of fields including Magnetic Resonance Imaging in medicine – enables the retrieval of this spectral information.
"The PFS is a powerful but extremely delicate instrument," Formisano adds. "Mechanical deformations as small as a micron – less than the width of a bacteria – can wreck the experiment completely. At the same time the instrument has to be robust enough to survive the launching phase vibrations."
The unique reflective properties of the corner cubes mean that even if the instrument is tilted the light beams continue to propagate in precisely the same direction as before.
PFS currently carries out around 300 measurements per martian orbit, its activities concentrated around the hour and a half when the Mars Express spacecraft is at its closest to the planet. From an altitude of 300 km the short wavelength channel has a 1.6 degree field of view, while the long wavelength channel has a 2.8 degree field of view, equivalent to spatial resolutions of seven km and 14 km respectively.
One advantage of its design, compared to other types of spectrometers, is that the PFS observes the entire spectrum at all times and its overall signal-to-noise ratio can be improved simply by increasing the total number of observations. Since Mars Express reached orbit some 105 000 measurements have been carried out, a number that is constantly growing.
There are Earth-based spectrometers with higher spectral resolution but none possessing such a wide sampling range across almost all the infrared wavelengths. Plus, instruments on Earth have to contend with the terrestrial atmosphere being between them and Mars, making precise measurements of trace gases very difficult.
Of course, positioned millions of kilometres from Earth, the PFS instrument has to be self-calibrating. This is done by having PFS recalibrate itself between observations by making a comparison to a cylindrical ‘black body’ at spacecraft temperature and the cold emptiness of deep space.
Weekly Results
Here you will find the weekly results obtained from the PFS Instrument on Mars Express.
Hot Topic
The PFS has made observations of the non-Local Thermodynamic Equilibrium (LTE) emission by CO and CO2 molecules in the upper atmosphere of Mars.
The Future
A busy time lies ahead for the PFS team as increasing data accuracy opens up fresh lines of Martian enquiry.
PFS en route to Venus
A second PFS instrument is now on its way to Venus, on board ESA’s Venus Express spacecraft launched on 9 November from Baikonur in Kazakstan.
Showing PFS results
The saying goes that a picture is worth a thousand words. However when it comes to exploring Mars, the supply of infrared spectra from the Planetary Fourier Spectrometer (PFS) instrument is more valuable than the most spectacular single image of Mars.
PFS on Mars Express makes non-LTE observations
The Planetary Fourier Spectrometer (PFS) on board Mars Express has made limb observations of the non-Local Thermodynamic Equilibrium (LTE) emission by CO and CO2 isotopic molecules in the upper atmosphere of Mars, the results of which may mean that presently available non-LTE models need to be modified.
1060 cm-1 ‘hot bands’ and the radiance emitted was in excess of the thermal energy available. These observations led to the development of a number of non-LTE models to explain this phenomenon.
An extensive study of the same hot-band emission (9.4 and 10.4 microns) by Mars Global Surveyor found that non-LTE emission from these hot bands was observed over a range of 120 degrees in latitude. This emission was observed between the altitudes of 50 and 90 km with the tendency to decrease at lower heights toward the sub-solar point, where also the maximum of the emission was observed.
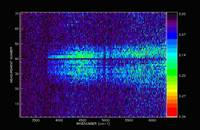
Figure 1 – Orbit 1234 . Spectrogram of the measurements of the SW channel between 2100 and 2950 cm-1. The colour code is automatically chosen to span all colours over the available radiance variation and is given on the right in ergs/(s sr cm2 cm-1) .
Non-LTE emission at 4.3 microns had been observed first with ESA’s ISO spacecraft and more recently with nadir-viewing observations with the PFS on Mars Express. ISO was observing the infrared spectrum of Mars from Earth, and found evidence of the non-LTE emission inside the 4.3-micron CO2 absorption band. PFS’s nadir observations found a clear double band in emission due to non-LTE effects in the upper atmosphere.
It is now thought that most of the peak emission (around 2320 – 2340 cm-1) was coming from an altitude region between 100 and 140 km, while outside the strongest lines of the R- and P- branches (at 2300 or 2350 cm-1) the layers contributing the most were in the mesosphere, between 80 and 120 km.
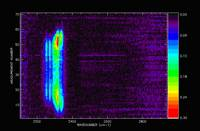
Figure 2 – Orbit 1234 . Spectrogram of the measurements of the SW channel between 3150 and 6300 cm-1. The colour code is automatically chosen to span all colours over the available radiance variation and is given on the right in ergs/(s sr cm2 cm-1).
Some limb measurements of the OMEGA experiment on Mars Express recently found CO emission with a peak emission at 50 km, while CO2 emission was observed mostly above that height.
In this study, PFS looked at two orbits, exploring latitudes from 75 to 15 degrees. Due to the orbit and the attitude of the spacecraft, these PFS observations were tangent to the planet and never intersected with the surface or even altitudes below 80 km. Emission from CO and CO2 was observed, with the CO emission peaking at altitudes lower than the CO2 emission peak.
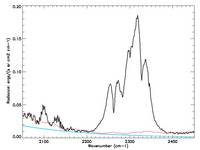
Figure 3 – Average spectrum over the entire set of measurements. Note the presence of the CO emission at 2100 cm-1. The red line is the deep space signal, while the blue curve is a Planckian at 190 K.
In general, in the season observed (northern summer), the emission intensity increased with lower latitudes. The peak emission height also decreased with decreasing latitude. By comparison with Hitran database, the emitted bands were identified as the second hot band for the 626 and 636 molecule, while for the 628 and 627 the band emitted was possibly the third hot band. Other minor bands or lines are also observed in the emission.
The most important aspect of the CO2 emission is the intensity of the emission from isotopic molecules like 636 and 628. The CO2 isotopic molecules were found to be emitting radiance out of proportion with respect to the normal isotopic abundance: the measured intensity of the 636 and 628 isotopes were comparable (within a factor roughly 2) with the emission of the molecule 626, while their isotopic abundance was of the order of 1/90 and 1/250 respectively.
Figure 5 – Altitude – latitude profile of the optical axis of PFS, for the 71 measurements. The colour lines connect the 2 measurements with the max 626 emission (blue line), 636 emission (green line), CO emission (yellow line), and scattered radiation (brown line). See text.
The intensity of the radiation emitted by these molecules should be, therefore, much below the intensity of the radiation emitted by the main isotope 626 if only direct solar excitation would be working.
The observed ratio for the isotope 636 is of the order of 2, so either this isotope is much more abundant at this altitude (which sounds very unlikely) or there is a strong pumping of energy from normal 626 to 636 by means of collisions, so that excitation is transferred from normal isotopic molecule 626 to the isotopic 636 one.
The same is also occurring for the 628 isotopic molecule, which in the second case studied (orbit 1413) appears to be emitting more than the 636 molecules, although their isotopic ratio would indicate an emission 2.8 times lower. In this case, however, modelling is needed to be able to estimate the radiance intensity, as its band adds to that of the 626 isotopic molecule.
Figure 6 – PFS average spectrum over all the measurements showing scattered radiation.
For more information:
Prof. Vittorio Formisano
Istituto di Fisica dello Spazio Interplanetario INAF-IFSI,
Via del Fosso del Cavaliere 100, 00133 Roma, ITALY
Phone: +39 064 993 4362 | Fax: +39 064 993 4074
E-mail address: Vittorio.Formisano @ ifsi.rm.cnr.it
The full paper was written by V. Formisano, A. Maturilli, M. Giuranna, E. D’Aversa and M.A. Lopez-Valverde.
The first plot presents, in colour code, the air temperatures vs. altitude along an orbital track of PFS. Black solid curves connect points with the same temperatures. Labels give the actual values, in kelvins. PFS sensitivity is particularly high in the altutide range 5-45 km. Altitudes are taken from MOLA data.
The second plot provides the value of the integrated dust optical thickness measured at 1100 cm-1. This quantity is proportional to the total content of silicate aerosol in the Martian atmosphere above the observed region. The altimetry of surface (in metres) is also given for comparison.
The third plot provides the value of the surface temperature, as estimated from the planet’s IR emission in the spectral range covered by PFS LWC. The altimetry of surface (in metres) is also given for comparison, as well as the Sun’s altitude above the horizon.
PFS – The Future
PFS – appearing next on Venus Express
A busy time lies ahead for the Planetary Fourier Spectrometer (PFS) team as increasing data accuracy opens up fresh lines of Martian enquiry. Another version of the instrument has been launched on board ESA’s Venus Express mission – and possibly a third PFS is set to orbit Earth.
PFS has been designed so that its signal to noise ratio increases with the total number of measurements made, giving a progressively more accurate representation of Mars.
"In terms of CO2, the combinations you can have are carbon 12, 13 or 14, and oxygen 16, 17 or 18," Formisano said. "The actual isotopic composition we find may have a bearing on the history of the Martian atmosphere. And life on Earth discriminates against heavy isotopes, so if life on Mars is present underground then it may be having an effect on the atmosphere."
Down on the surface, PFS data have been used to estimate surface pressure and altimetry – for example following the slopes of the Olympus Mons volcano up to its 25-kilometre summit, and tracing how surface temperature, pressure and wind fields relate to height. Intriguing anomalies have been detected in the observed temperature against that predicted from elevation and sun angle. Possibly due to dust clouds or differing thermal inertia in the soil, it is another subject due for further investigation.
The top of the atmosphere is another planned area of enquiry. PFS mostly performs downward ‘nadir sounding’ measurements, but it also has the ability to carry out sideways ‘limb sounding’ observations, to monitor the stratified atmosphere to more than 100 kilometres in height.
"If this goes ahead we would especially like to measure the thermal radiation of the atmosphere to compare it against measurements done thirty years ago," Formisano added.
Such a view should augment the instrument’s ability to investigate so-called non-local thermodynamical equilibrium (non-LTE), where molecules of the upper atmosphere are excited energetically by solar particles – an occurrence of special interest because it is also observed in the corona of stars.
In addition, ESA has agreed in principle to fly a third PFS – a flight model spare – up to the International Space Station, enabling comparative studies of the atmosphere across all three Earth-like worlds.
"If this goes ahead we would especially like to measure the thermal radiation of the atmosphere to compare it against measurements done thirty years ago," Formisano added. "That way we could assess in a very direct way whether heating is taking place."
Gallery
Module P, Power supply of PFS
Module E, the digital Electronics during the vibration tests
Module S, the pointing mirror during the vibration tests
PFS in the thermo-vacuum chamber
Prof. Fonti, working on the closing of the Module O
Module O, core of the experiment
Close up view of the interferometer
PFS integrated on Mars Express spacecraft
Close up view of the interferometer
Entrance group detail
Fringes video
‘Yardangs’ on Mars